![]()
Optimize your network performance with PRTG
- All your network's performance key stats in one place
- Easily spot and troubleshoot performance issues
- Make data-driven infrastructure-planning decisions
Our users give top ratings for monitoring with Paessler PRTG


PRTG network performance monitoring: What you’ll find on this page

PRTG makes network performance monitoring easy
Custom alerts and data visualizations make it easy to monitor, identify, and prevent low bandwidth, overloaded servers, and other network performance issues.
Wanted: 100% uptime
It's every sysadmin's dream. Well, that, and winning the lottery so you can retire to the Bahamas.
But even if you were to achieve it, 100% uptime would do your network little good if it still struggled with low bandwidth, overloaded servers, or virtual machines that performed like it's a Sunday afternoon in August.
Paessler PRTG tracks the availability, health, and performance of every component in your network, 24/7. That means you'll find out about any issues (and be able to fix them) before your colleagues can notice, and plan ahead so your infrastructure is always well-placed to support your organization's growth.
PRTG is compatible with all major vendors, products, and systems
![]()
Automated, accurate, forward-thinking: Why choose PRTG as your network performance monitoring tool
All-in-one monitoring
Track the performance of all your network components from one place: network speed, data traffic, bandwidth usage, server performance, CPU load, application performance, virtualization, Windows performance, and much more. PRTG monitors everything round the clock, showing you detailed stats in intuitive, user-friendly dashboards.
Real-time alerting
Nip potentially serious network issues such as performance bottlenecks or sudden drops in performance in the bud. Pick your preferred warning and error thresholds, and PRTG will email, text, or send an in-app notification when you're at risk of going under or over, so you can fix them promptly and avoid disruption (and colleagues' complaints).
Proactive planning
Your CEO has big growth plans. But can your IT infrastructure support them? PRTG puts key performance data – live data or historical data of up to 365 days – at your fingertips, so you can spot where you're under- or over-resourced, and make better-informed choices about where (and on what devices, systems, and services) to invest.
Complete customization
Your network, your rules. Tailor PRTG's powerful and flexible network performance monitor tool so it meets your exact needs. Choose which components and parameters to track, and how PRTG presents the data. In fact, why not create your own bespoke dashboards? Just use our built-in, drag-and-drop map editor and design your monitoring overview the way you like.
What network performance monitoring looks like in PRTG
Diagnose network issues by continuously monitoring bandwidth usage, server performance, CPU load, and other components across your network. Show availability, data transfer speeds, and other key stats in real time and visualize data in graphic maps & dashboards to identify problems more easily. Gain the visibility you need to troubleshoot bottlenecks, underperformance, and other issues.

Device tree view of the complete monitoring setup
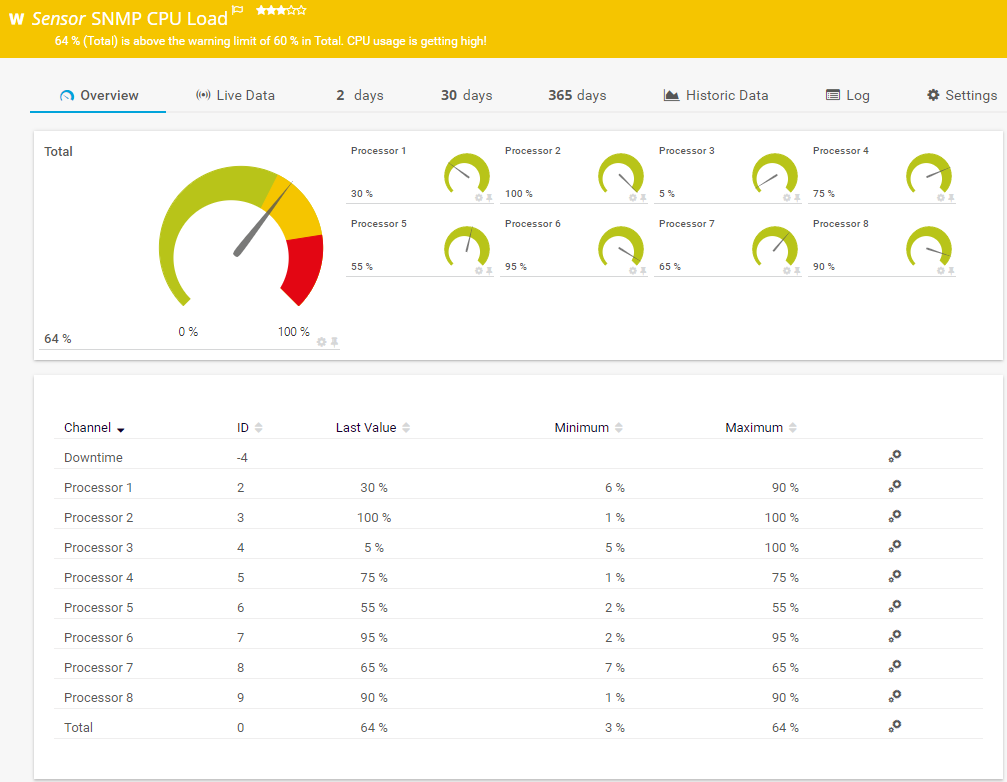
SNMP CPU Load sensor in PRTG showing the warning status
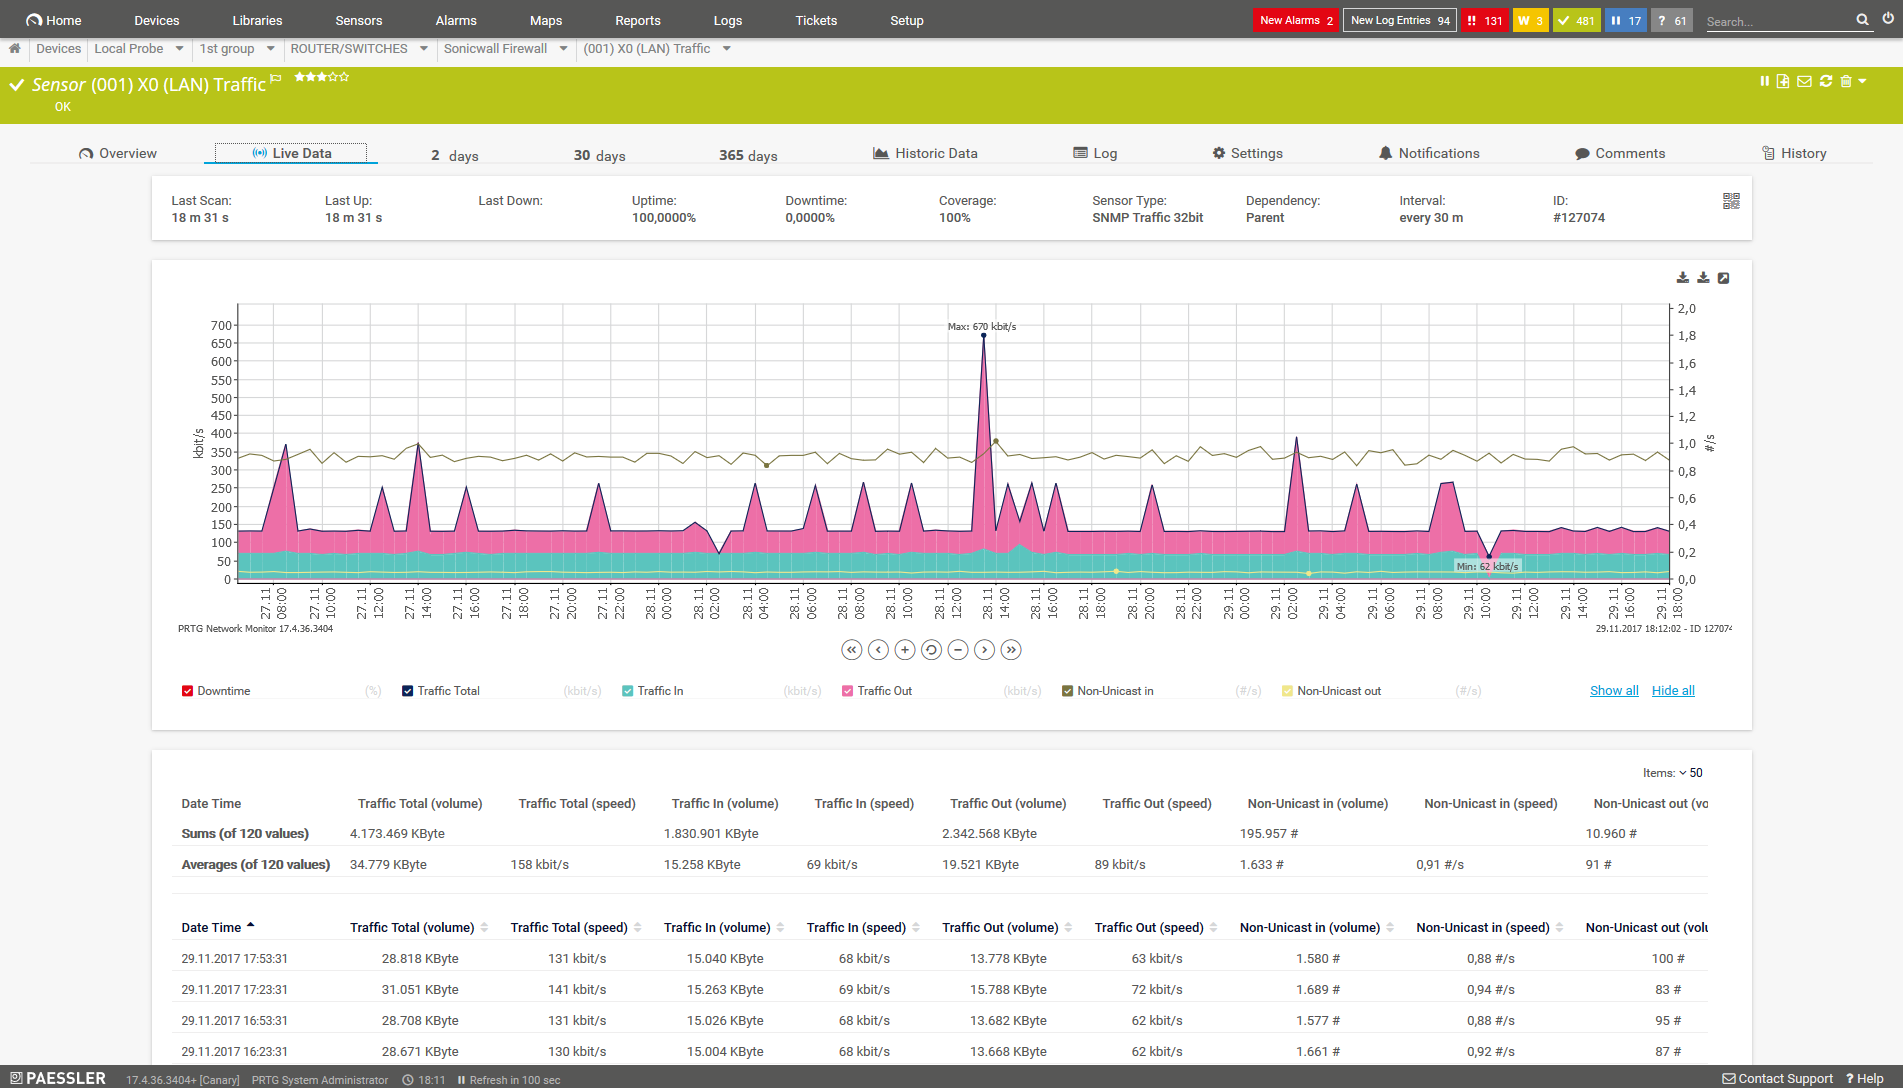
Live data graph for keeping an eye on traffic peaks
Start monitoring network performance with PRTG and see how it can make your network more reliable and your job easier.
“All-around winning “The real beauty of PRTG is the endless possibilities it offers” “PRTG Network MonitorIT experts agree: Paessler PRTG is a great solution for IT infrastructure monitoring

network monitor”

is very hard to beat”
All the pieces matter: How PRTG ensures optimal network performance
If it's part of your network, PRTG probably has a sensor type (or more than one) you can use to keep an eye on it:
- Application performance monitoring, including cloud-based applications, and monitoring the underlying server hardware, for example, SQL and Exchange servers, web servers, mail servers, and servers for hosting virtualized environments
- Bandwidth consumption, including shortages, download and upload speed, overloads, router traffic peaks, data packet loss, and other issues
- Critical server performance parameters, including domain name resolution, mail delivery, CPU load, or RAM
- Windows perf monitoring for measuring the performance of Windows software via Windows performance counters
Your network performance monitor at a glance – even on the go
Set up PRTG in minutes and use it on almost any mobile device.


Easily find the source of the problem with our PRTG network performance monitoring solution
Real-time alerts and custom notifications make it easy to solve issues such as overloaded servers, low bandwidth, and slow virtual machines.
“Excellent tool for detailed monitoring. Alarms and notifications work greatly. Equipment addition is straight forward and server initial setup is very easy. ...feel safe to purchase it if you intend to monitor a large networking landscape.”
Infrastructure and Operations Engineer in the Communications Industry, firm size 10B - 30B USD
Monitor network performance: FAQ
What is network performance?
Network performance refers to the efficiency and effectiveness of data transfer and communication within a computer network. It is measured by factors such as bandwidth, latency, and reliability. Higher network performance indicates faster data transmission, lower delays, and a more stable connection.
What is network performance monitoring?
Network performance monitoring involves the continuous observation and analysis of a computer network's key metrics to ensure optimal functionality. This process includes tracking factors such as bandwidth utilization, latency, packet loss, and device performance. By using specialized network performance monitor tools and software, administrators can identify issues, troubleshoot problems, optimize the network for efficient data transfer, and prevent downtime.
What is PRTG network performance monitoring software?
PRTG is a proprietary software tool that tracks the health and performance of every component that forms part of your network. Available for Windows-based on-premises servers or as a cloud-hosted solution, it's capable of monitoring unlimited local, remote, and virtual network devices, bringing critical system data together in one simple, intuitive interface you can access from anywhere: at the office, at home, or on the go.
Why use Paessler PRTG network performance monitoring tools?
Because it's comprehensive, infinitely customizable, and suitable for long-term monitoring — perfect for getting to the bottom of intermittent issues. "Of course you'd sing your own praises," we hear you say. Well, the proof of the pudding is in the eating. Try PRTG for free, no strings, and see for yourself. 80% of our paying customers say PRTG pays for itself within weeks.
Can PRTG also test network performance?
Yes. Use the Ping v2 sensor to check the availability of all devices in your network and test network performance. And if a device is connected to the network via ethernet, that's no problem. Use PRTG's ethernet monitoring capabilities to test your wired connections and the overall performance of your LAN.
What is a sensor in PRTG?
In PRTG, “sensors” are the basic monitoring elements. One sensor usually monitors one measured value in your network, for example the traffic of a switch port, the CPU load of a server, or the free space on a disk drive.
On average, you need about 5-10 sensors per device or one sensor per switch port.

PRTG: The multi-tool for sysadmins
Adapt PRTG individually and dynamically to your needs and rely on a strong API:- HTTP API: Access monitoring data and manipulate monitoring objects via HTTP requests
- Custom sensors: Create your own PRTG sensors for customized monitoring
- Custom notifications: Create your own notifications and send action triggers to external systems
- REST Custom sensor: Monitor almost everything that provides data in XML or JSON format
More than just a monitoring tool:
Reasons our customers love PRTG


Paessler PRTG is used by companies of all sizes. Sysadmins love PRTG because it makes their job a whole lot easier. Bandwidth, servers, virtual environments, websites, VoIP services – PRTG keeps an eye on your entire network. Everyone has different monitoring needs. That’s why we let you try PRTG for free.Still not convinced?
![]()
More than 500,000
sysadmins love PRTG![]()
Monitor your entire IT infrastructure
![]()
Try Paessler PRTG
for free
![]()
Start monitoring network performance with PRTG and see how it can make your network more reliable and your job easier.
|
PRTG |
Network Monitoring Software - Version 24.2.94.1424 (May 2nd, 2024) |
|
Hosting |
Download for Windows and cloud-based version PRTG Hosted Monitor available |
Languages |
English, German, Spanish, French, Portuguese, Dutch, Russian, Japanese, and Simplified Chinese |
Pricing |
Up to 100 sensors for free (Price List) |
Unified Monitoring |
Network devices, bandwidth, servers, applications, virtual environments, remote systems, IoT, and more |
Supported Vendors & Applications |
|